
Protection Orders – The Quantitative Figures
The data used to create these charts is sourced from the Family Court Website.
I have published them in order to assist in critiquing the social marketing disguised as qualitative research of Waikato University Academics.
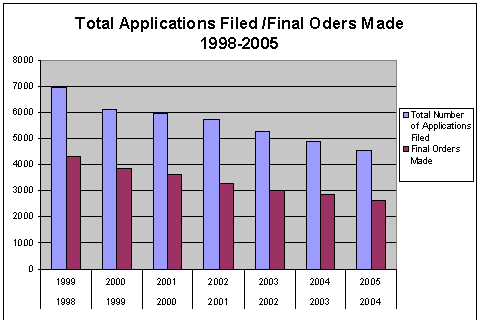
This shows a continuing decline over-time of applications filed and final orders made since the 1998-1999 year.
If you think about the amount of resources and focus that have been put into eliminating “domestic violence ” one would expect to see a reduction in the number of protection orders issued over time.
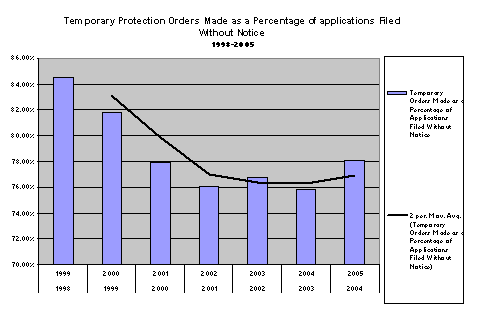
This graph shows that the figure for: Temporary protection orders made as a percentage of applications filed without notice.
The lowest figure is 75.8%. That shows since 1998-99 at least 3 out of 4 applications made without notice are made into temporary orders. While declining for a form a high of about 84% (1998-99) to a low of about 76% (2003-04) the number is increasing.
So if you are a woman and you apply for a protection order without notice 3 out of 4 times you will be granted the temporary protection order.
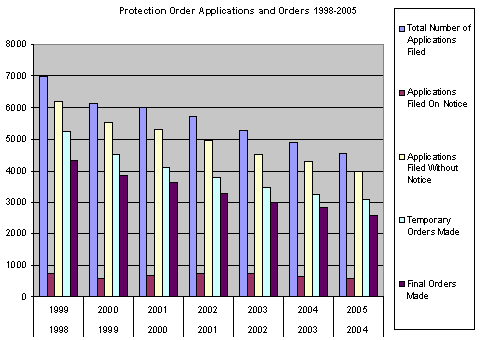
One final chart and I’ll leave it at that.
It speaks for itself.
Regards
Scrap


